my Walkable City
(Python) Passion project using spatial data to visualize walkability in the Twin Cities, MN.
In this personal passion project, I use publicly-available spatial data on bike paths, public buildings, and parks (obtained from the MN Geospatial Commons) to explore walkable, bikeable locations in the Greater Twin Cities!
The idea for this project was born from house-hunting in the Twin Cities. While considering locations, I wanted to know where I would have easy access to bike paths, parks, groceries, and medical facilities. The concept of the “15-minute city” is a popular discussion on city planning; attempting to plan such that all people live “15-minutes” walking or biking to their basic necessities.
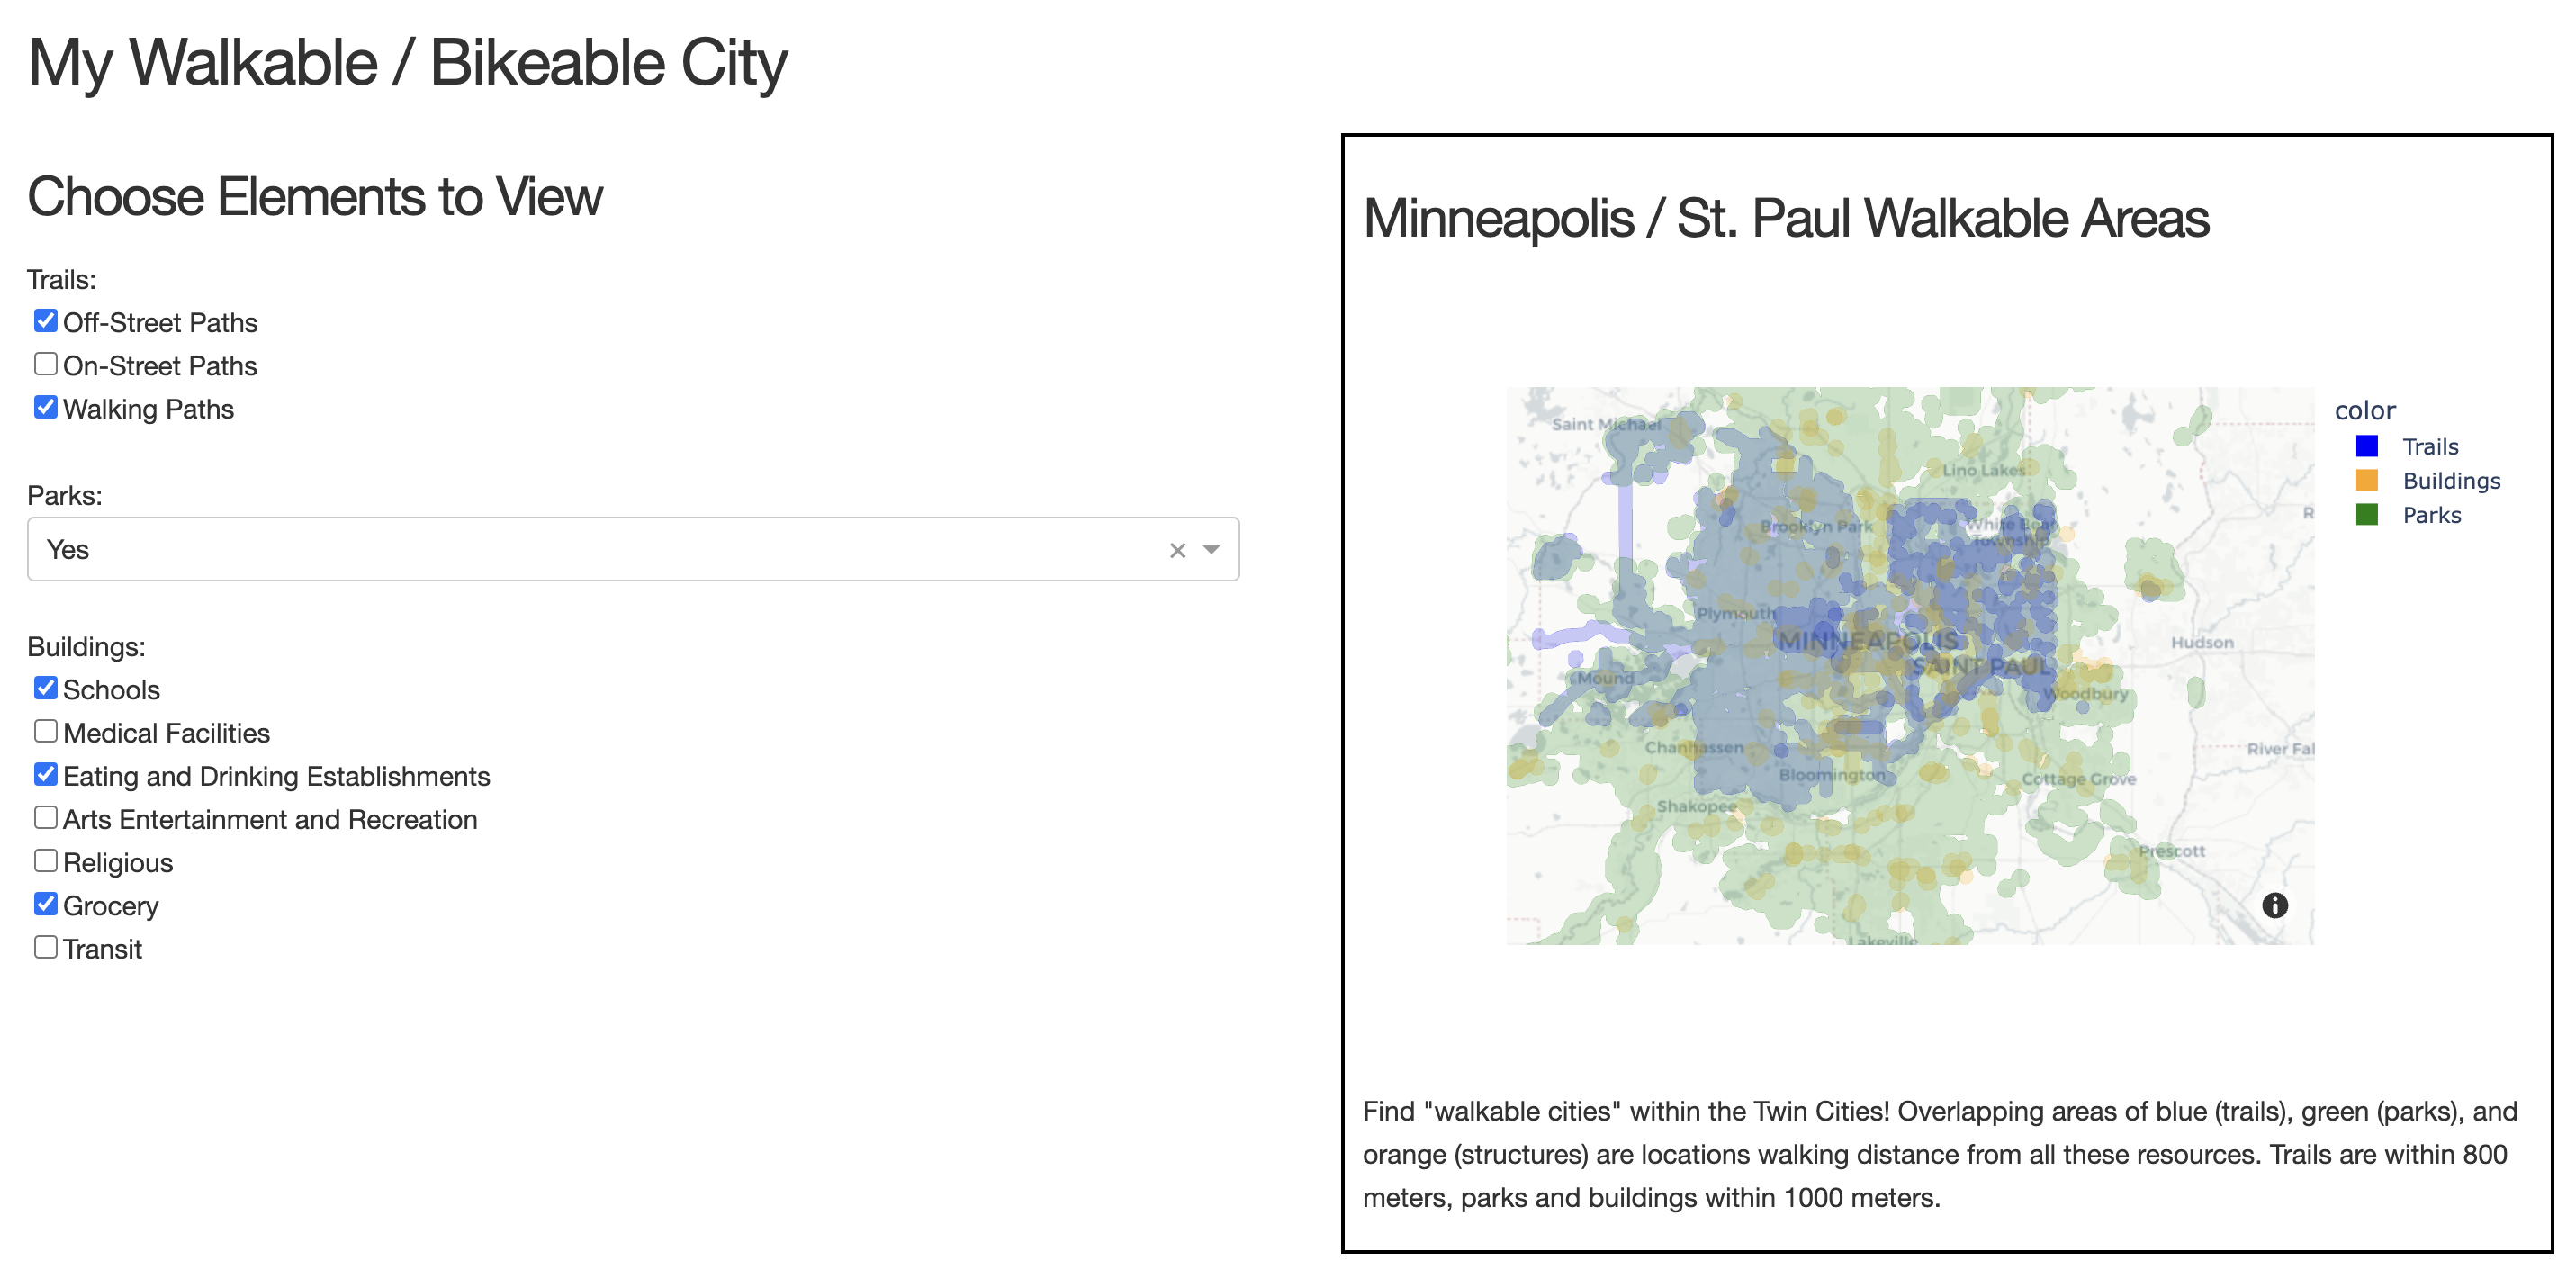
With that, I introduce myWalkableCity! A Dash application (implemented in Python and hosted on Render) which attempts to visualize the overlap of various necessities in the Twin Cities, MN.
myWalkableCity
Spatial Data & Buffers
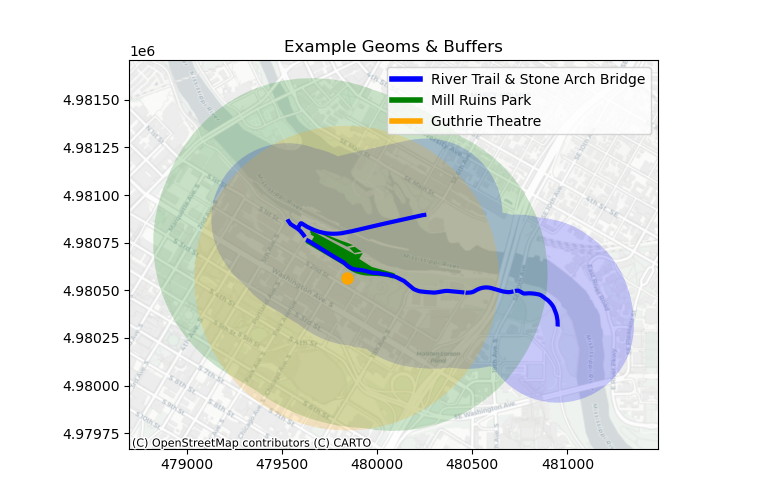
First, I had a series of geometries from MN Geospatial Commons representing parks and buildings (bolded colors below). I wanted to create “buffers” which represent the walkable distance from these paths, parks, and buildings (lighter colored areas).

Overlapping Buffers & Geometries
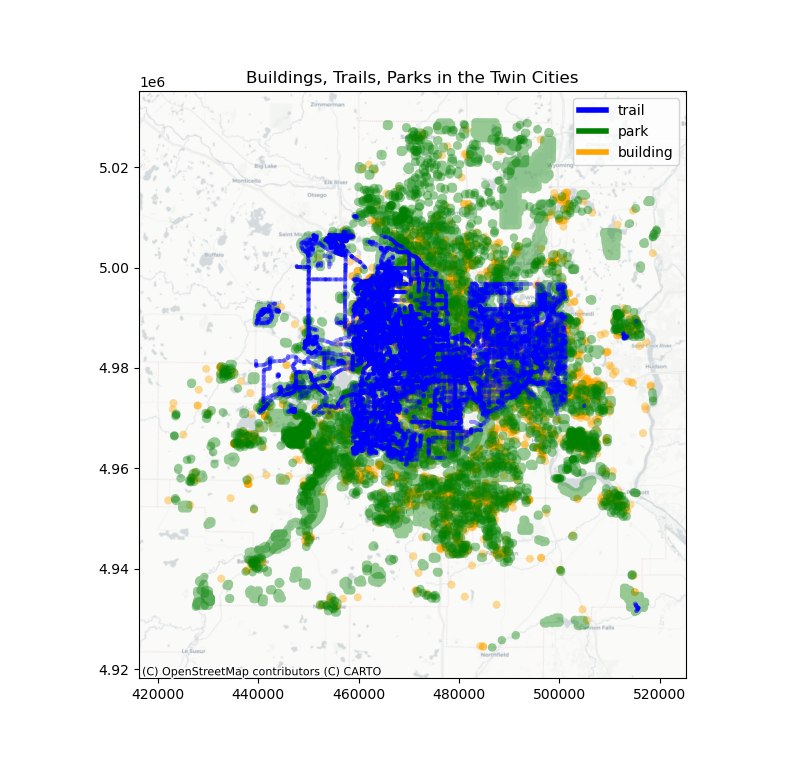
Next we can visualize all these geometries in Twin Cities area. Great! But… this is a bit overwhelming and not very interactive! Also, the plot can be slow to render with so many overlapping geometries.

A solution to our time & interactivity problem : (1) Combine overlapping buffers of the same type (i.e. same type of path connected to one another). (2) Create an interactive Dash application to pick and choose important features.
Building an Interactive Dash

And, ta-da! We have made an interactive tool for finding “walkable cities.”
Future Directions
There are many improvements that could be made to this tool for further exploration.
First, hosting on a faster platform than the free version of Render would improve usability.
Second, the plotly map could be made more interesting by introducing “hover” information that would tell you what the park name, path name, or building name is in a particular region. Would be wonderful to give some more detailed context in the visualization.